


Challenge
The House of HR wanted a more creative solution for their Investor Relations presentation of their 'Annual Report 2023' to their stakeholders. This presentation uses a lot of data (text, graphs and tables), making the slides a bit more text-heavy.
Solution
We used the new corporate identity of the Annual Report to present all data in a very clear and creative way. The presentation provided a clear insight into the activities, the business model and the most recent annual results of the House of HR.
54
investor slides
39
charts
15
tables


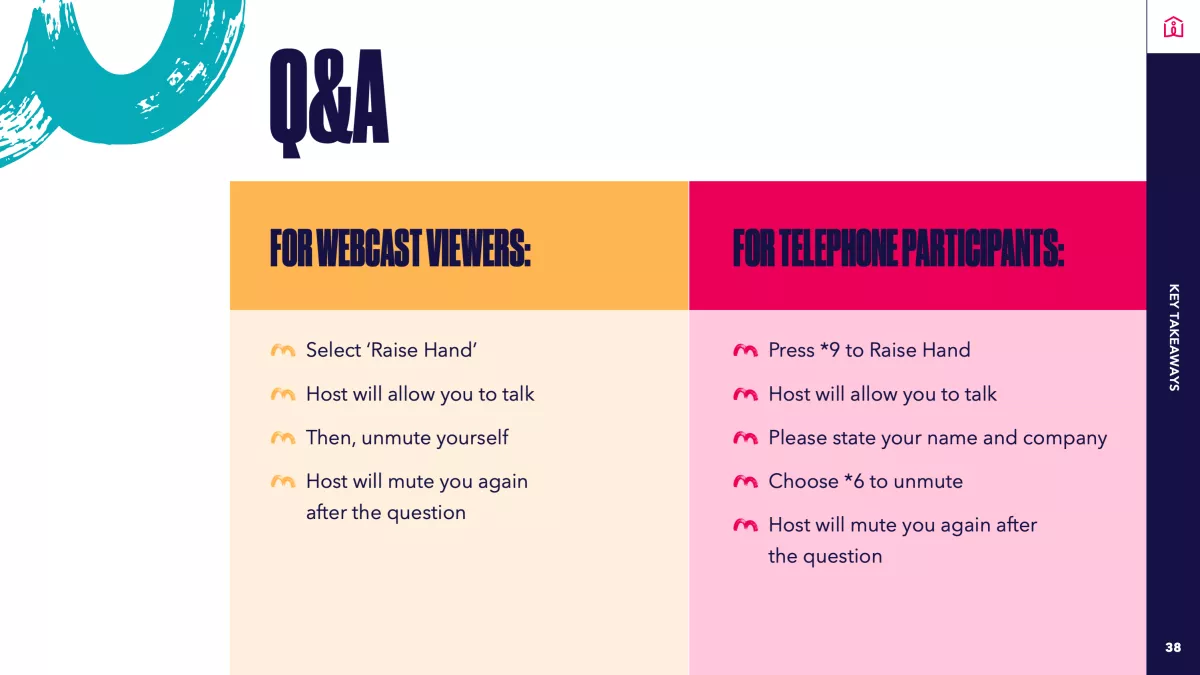
Explain Q&A
during online presentation

Key takeaways
to conclude

Even in a finance deck
always add a CTA
“We are very happy with the cooperation with Shoow.
They delivered creative yet clear slides that perfectly align with the format and styling of our annual report.”
They delivered creative yet clear slides that perfectly align with the format and styling of our annual report.”
Mathieu Dejonghe
Treasury Analyst & Investor Relations


TITLE FONT
Druk
TEXT FONT
Avenir Next

Data visualisation
by charts

Data visualisation
by tables

Data visualisation
by text


